

Analytics - Interactive Factory platform
Data-driven decision-making. Analyse what are the manufacturing efficiency losses and establish improvement plans for future.
Real-time and historical data analysis for smarter decisions
Analytics is the cornerstone of data-driven decision-making across your manufacturing. With the capability to analyse both real-time and historical data, you gain valuable insights into production processes. Whether you're a Shopfloor manager seeking to optimise operations or a company CEO making strategic choices, Analytics provides the data you need for informed and timely decisions. The real-time accessibility via the Dashboard page ensures that critical metrics are always at your fingertips, empowering you to make quick adjustments that drive efficiency and success.
Integrate, compare, and optimise with Analytics
We understand that data analysis is not one-size-fits-all. That's why Analytics offers a diverse range of reporting options to fit to your unique requirements. Whether you prefer interactive charts that vividly represent trends or detailed tables for structured analysis, our platform has you covered. The ability to compare data from multiple devices and time periods adds another layer of flexibility. Analytics tailors reports to your specifications, ensuring that you get the precise insights necessary for your operations.

Tailored reports for unique needs
Analytics simplifies the process of comparing different time periods, allowing to uncover trends and patterns that help optimise your processes. Whether examining performance month-to-month, quarter-to-quarter, or year-to-year. Equipped with real-time and historical context, you can forecast challenges and make data-driven decisions that pave the way for success.

Objective KPI insights for faster responses
Analytics easily integrates into existing factory ecosystems. With APIs for integration and a Google Connector for automated exports, you can ensure data consistency and accessibility across departments and ERP. This integration capability simplifies factory workflows and allows to harness the full potential of shopfloor data. It's about making data work for you, effortlessly.

Boost efficiency, cut costs, and increase profits
Have critical performance metrics like Overall Equipment Efficiency (OEE), interruption data, production statistics, and shift details right at your fingertips. With our analytics platform, this becomes a reality. The information you need is just a few clicks away, eliminating the need for time-consuming data retrieval processes. Analytics helps companies identify inefficiencies, optimise processes, and reduce unnecessary expenses, thereby enhancing productivity and profitability.
Analytics Overview
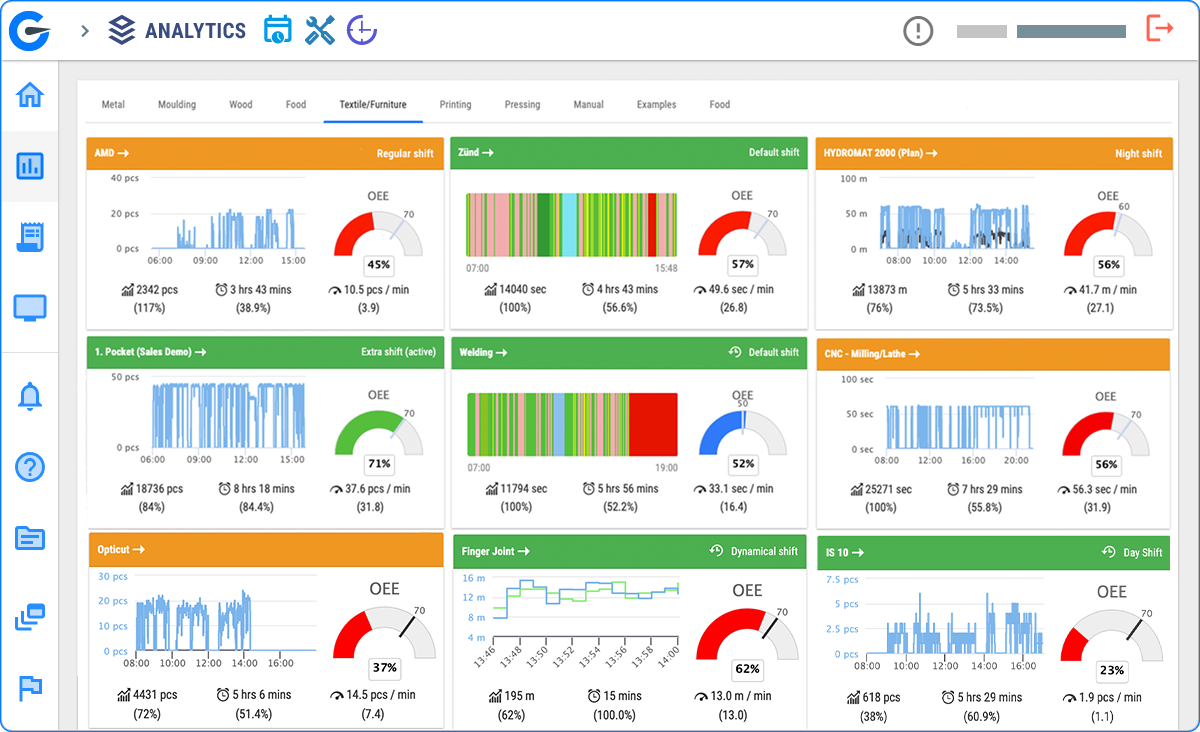
Real-time dashboard of factory machines
Factory machine Performance, Availability and Quality in real-time
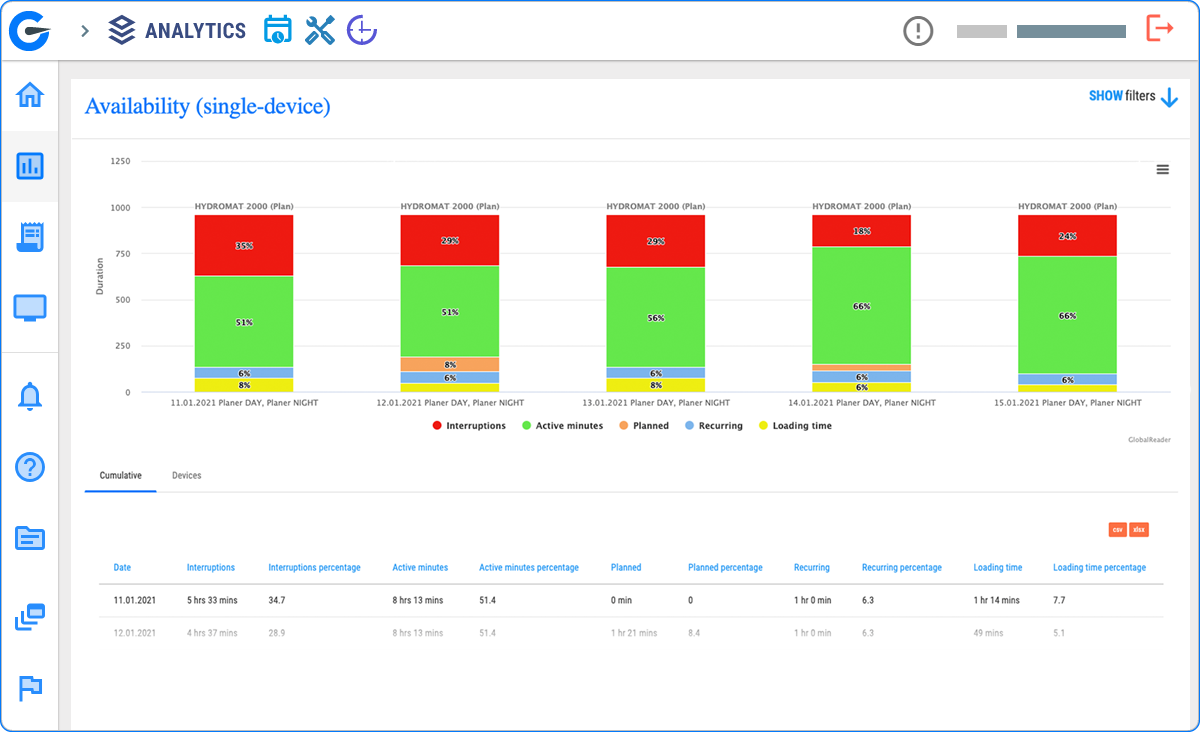
Factory machine Availability - find what causes downtime
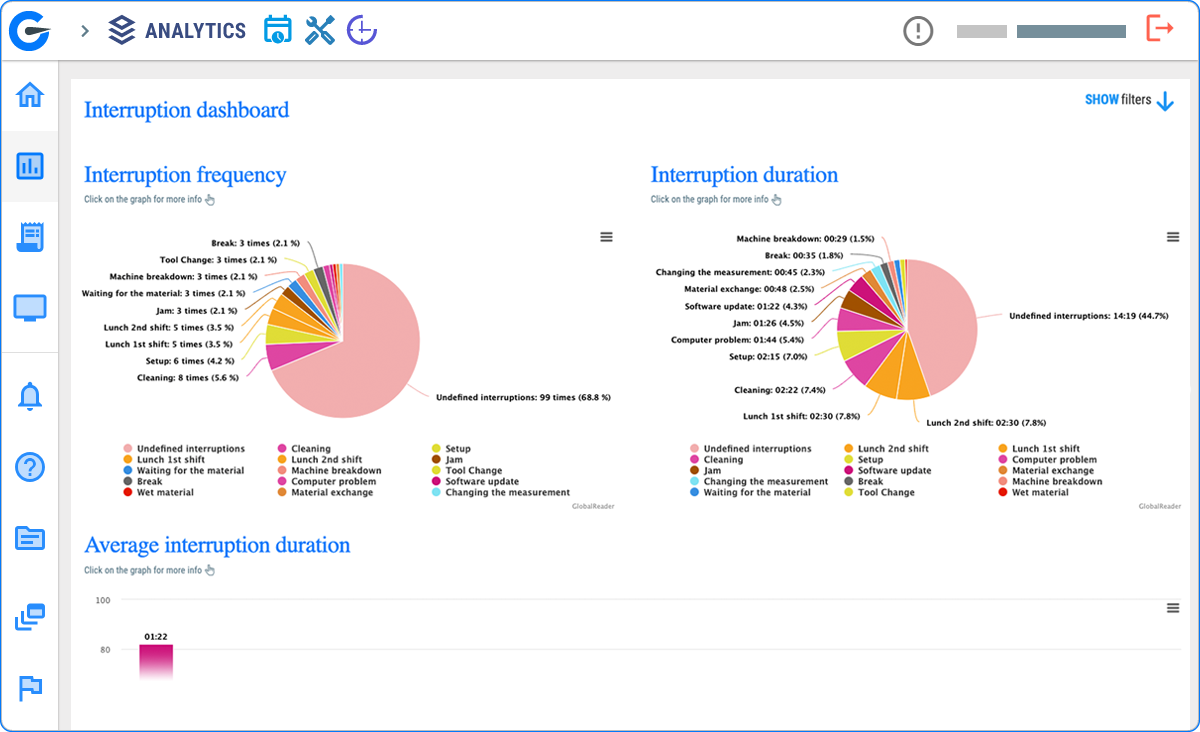
Understand manufacturing bottlenecks with Interruption Dashboard
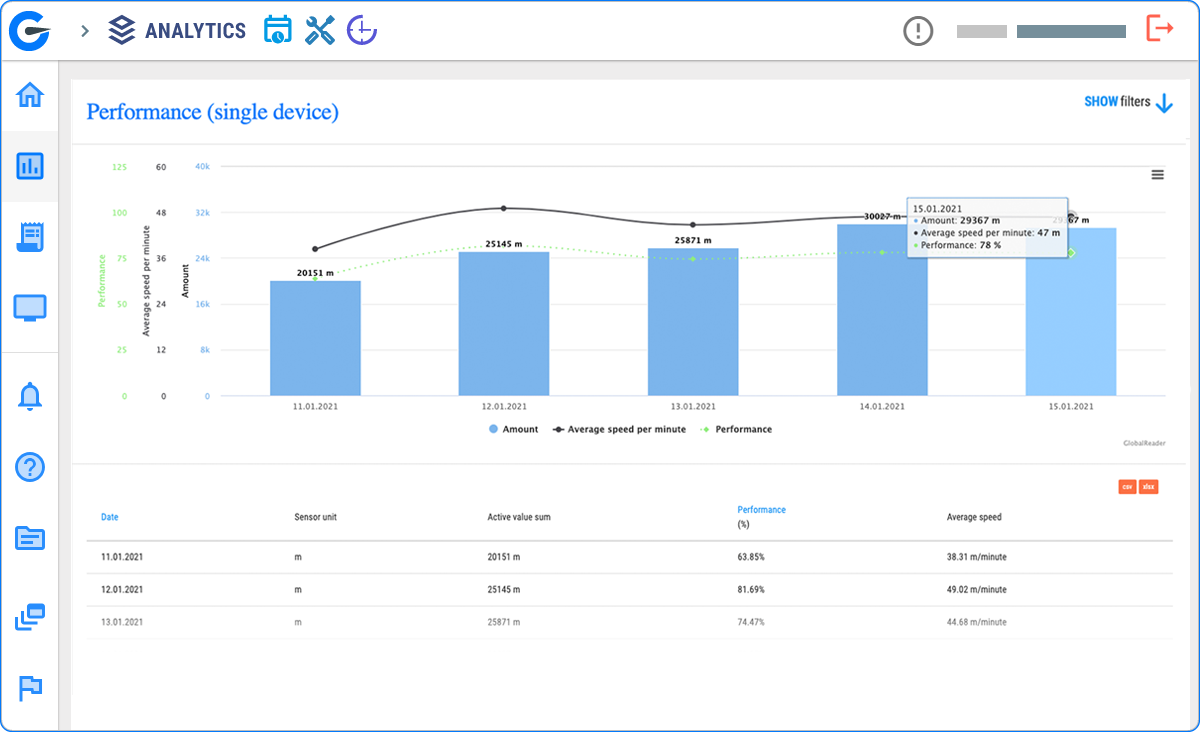
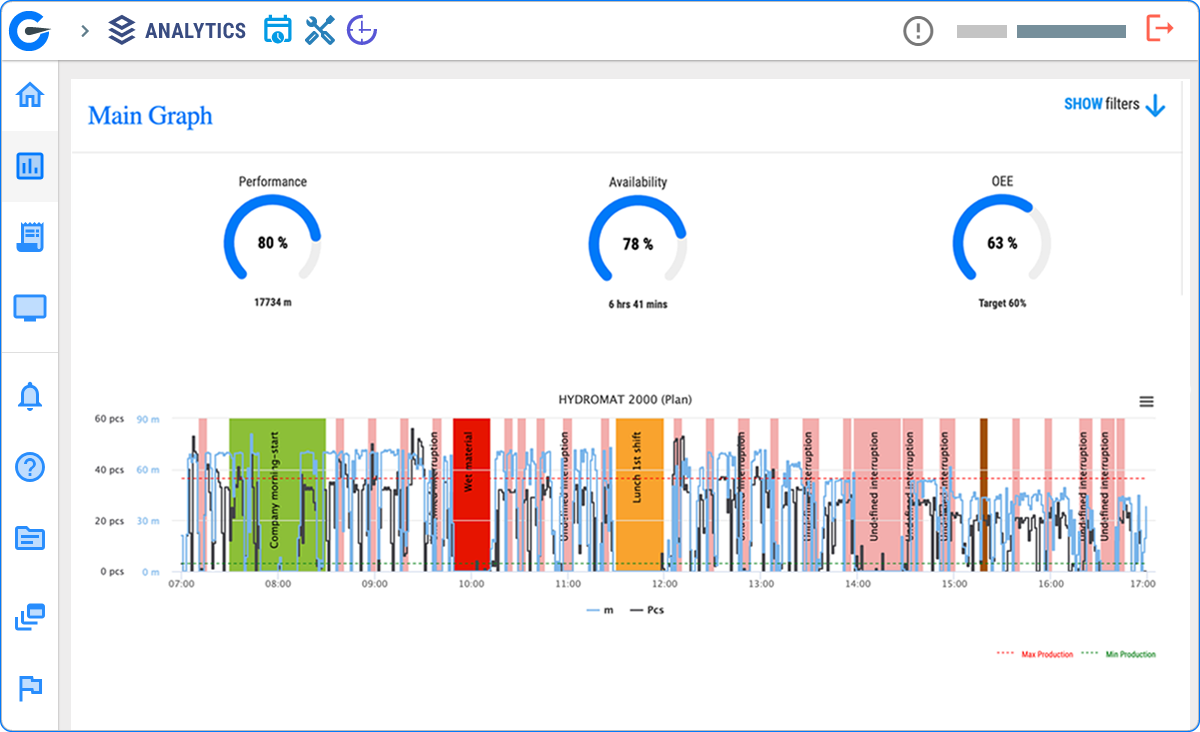
Access visualised OEE via Performance report

Boost efficiency by using Analytics alongside add-ons
Get alerts about the status of the machines directly from the production.

React instantly
NOTIFICATION
Have real-time overview of your production simply by displaying different reports and graphs on the screen.

Create transparency
SMART LIVEVIEW
Drive better decisions and improve production efficiency with AI-driven insights.
Get smart help
AI
Common Queries
-
When OEE is calculated manually or pulled from disconnected systems, every department reports a different number and root-cause discussions stall. GlobalReader's Interactive Factory Analytics platform reads signals directly from your machines and turns them into a single, objective OEE figure that the shopfloor, production manager, and CEO all see in real time. Customers using GlobalReader see an average OEE increase of 27.4% and availability gains of 22.8% within their first year, because everyone is finally looking at the same data.
-
Most factories lose 20-40% of potential output to micro-stops, slow cycles, and unreported downtime that never appear in ERP. GlobalReader Analytics surfaces interruption data, production statistics, and shift details machine by machine, so you can rank losses by euro impact. On average, our customers recover €39,200 per machine per year — for a 15-machine factory that's roughly €588,000 of recovered margin annually, with payback typically inside one day of production per month.
-
Manual data collection delays decisions by hours or days, which is when most losses compound. GlobalReader's Dashboard streams real-time KPIs — OEE, availability, performance, quality, and active stoppages — directly from each machine. Pair Analytics with the Smart LiveView add-on to display reports and graphs on shopfloor screens so the team can react to deviations within minutes instead of next morning's meeting.
-
Yes. GlobalReader Analytics is built around period and device comparison. You can compare any time range — shift vs. shift, week vs. week, quarter vs. quarter, year vs. year — and across multiple machines at once. Reports are available as interactive charts for trend spotting or as detailed tables for structured analysis, so production managers stop rebuilding pivot tables and start acting on patterns.
-
ERP integration is non-negotiable for serious manufacturers, and GlobalReader is built for it. Analytics ships with an open API and a Google Connector for automated exports, and we have proven integration patterns with the ERPs most commonly used in mid-sized manufacturing. Production data flows automatically into your existing systems — no double entry, no spreadsheet bridges — so finance, planning, and operations work from consistent numbers.
-
GlobalReader Analytics measures machines, not people. The data protects operators by exposing the real causes of downtime — material delays, maintenance issues, upstream bottlenecks — that previously got blamed on the line. Customers who position the rollout as a tool to improve working conditions and remove finger-pointing consistently see operator buy-in within the first weeks, because the system gives them objective evidence when something outside their control goes wrong.
-
GlobalReader is priced per machine per month, starting at €109 for the Foundation package plus optional Feature Modules from €23 — predictable and tied directly to scale. Against the validated €39,200 per machine per year of recovered output our customers achieve, the platform typically pays for itself within roughly one day of production output per month. For a 15-machine plant, that's a sub-1% cost-to-benefit ratio, which is the kind of business case that survives board scrutiny.
-
The core KPIs are Overall Equipment Effectiveness (OEE) and its three components — availability, performance, and quality — supported by interruption reasons, shift output, scrap rates, and changeover times. GlobalReader Analytics tracks all of these out of the box and lets you drill from a single dashboard tile down to the specific machine, shift, and reason code that caused a deviation, so KPIs become actionable instead of academic.
-
Both. GlobalReader Analytics combines real-time and historical context so you can compare current performance against the same period last month or last year and spot drifts early — a slowly creeping cycle time, a rising micro-stop frequency, an off-shift pattern. Combined with the Notification add-on, the system can alert managers the moment a machine deviates from its baseline, turning analytics from forensic into preventive.
-
GlobalReader Analytics breaks every KPI down by shift, by operator group, and by machine, so you can see exactly where the gap is and why. The platform isolates whether shift differences come from availability (e.g. longer changeovers on nights), performance (slower cycles), or quality (more scrap) — letting you target training, maintenance, or staffing changes with confidence rather than gut feel.
-
Yes. GlobalReader is hardware-agnostic and built specifically for mixed factory environments. Our edge hardware connects to PLCs, sensors, or signal lights on virtually any machine — modern CNC or 30-year-old press — and normalises the data into a single Analytics view. That means you don't have to standardise your machine park before standardising your KPIs.
-
Most GlobalReader customers are reading live OEE and interruption data within days of hardware installation, and running their first structured efficiency review inside the first month. Because Analytics ships with prebuilt reports for OEE, interruptions, production statistics, and shift performance, production managers don't wait on a BI team to configure dashboards — the insights are available out of the box and can be extended with the AI-driven recommendations add-on as needs grow
Let's Talk About Your Needs