

TEEP vs. Other Metrics – When to Focus on Each
While TEEP (Total Effective Equipment Performance) and OEE (Overall Equipment Effectiveness) are closely related, each serves a distinct purpose. Understanding their differences—and when to prioritise one over the other—can help you optimise your manufacturing operations more effectively.
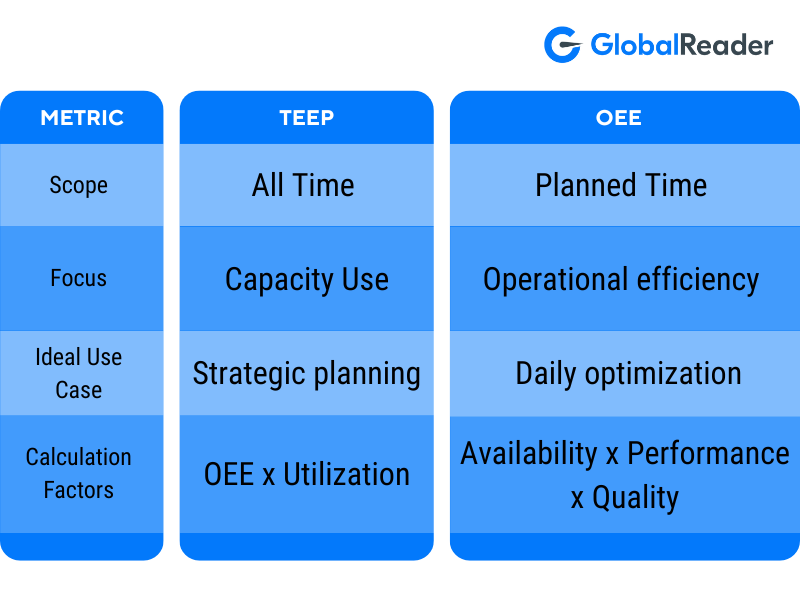
1. Key Differences Between TEEP vs OEE
2. When to Prioritise TEEP?
Strategic Capacity Planning: Use TEEP to evaluate how much additional throughput your operation could achieve by improving scheduling and efficiency.
Scaling Operations: For businesses looking to expand, TEEP provides insights into whether current resources can handle increased demand.
Identifying Hidden Potential: If your factory has low Utilisation, TEEP highlights the opportunities for improvement.
Example Use Case: A factory has a TEEP score of 35%, indicating significant unused capacity. Management decides to add weekend shifts and reduce changeover times, increasing TEEP to 55% within six months.
3. When to Prioritise OEE?
Daily Performance Management: Use OEE (Overall Equipment Effectiveness) to track and improve availability, performance, and quality during planned production hours.
Identifying Specific Inefficiencies: OEE helps identify issues like frequent machine breakdowns or high defect rates.
Short-Term Process Improvements: When the focus is on optimising day-to-day operations, OEE provides actionable insights.
Example Use Case:
A factory with an OEE of 60% has the following breakdown:
Performance = 90%
Quality = 95%
Availability = 70% (due to 20% unplanned downtime)
By implementing predictive maintenance, unplanned downtime is reduced by 20% of 30% planned production time affected by downtime, resulting in a 6% absolute improvement in availability (from 70% to 76%).
Using the OEE formula:

Thus, OEE increases from 60% to 65%, reflecting a realistic and achievable improvement through better maintenance strategies.
This demonstrates how targeting unplanned downtime can boost overall efficiency without requiring new equipment or major investments.
4. Using TEEP and OEE Together
For a comprehensive approach, combine both metrics:
TEEP gives a big-picture view of your factory’s total potential.
OEE zooms in on operational performance within scheduled hours.
Example:
A factory operates 24/7, meaning it has 168 total available hours per week. However, due to scheduling constraints, it only runs for 96 hours per week, meaning its Utilisation rate is:

The factory also has an OEE of 70%, meaning that during the scheduled production hours, it is operating at 70% efficiency.
Since TEEP is calculated as:

This factory identifies that its low TEEP is due to limited scheduling (low Utilisation).
Improvements Implemented:
Additional shifts increase Utilisation from 57% to 70% (e.g., adding weekend shifts).
Optimising machine speed and reducing defect rates improve OEE from 70% to 75%.
Now, recalculating TEEP:

Because of that, TEEP increases from 40% to 52.5%, showing a significant gain in total factory potential.
By expanding scheduled production time and improving OEE simultaneously, manufacturers can maximise their production capacity and efficiency without investing in additional equipment.
5. Choosing the Right Metric for Your Goals

GlobalReader’s Advantage: Combining TEEP and OEE
GlobalReader’s tools empower manufacturers to optimise both metrics seamlessly:
Real-Time Tracking: Monitor OEE metrics like availability and performance using real-time data collection.
Production Analytics: Generate reports that highlight TEEP opportunities, such as underutilised shifts.
Predictive Maintenance: Reduce unplanned downtime to boost both OEE and TEEP.
By understanding when and how to focus on TEEP and OEE, manufacturers can make informed decisions that improve both immediate performance and long-term capacity.
In the final section, we’ll summarise the actionable steps you can take to optimise TEEP and discuss how GlobalReader can be your partner in achieving these goals.
How to Optimise TEEP and OEE
Here’s how you can start improving both metrics using a data-driven approach:
Reduce Equipment Downtime to Improve OEE
Implement predictive maintenance to minimise unplanned stoppages.
Train operators to reduce changeover times and eliminate minor stoppages.
Use real-time alerts to detect inefficiencies before they impact production.
Check-out these Top 10 strategies to improve OEE
Improve Scheduling to Boost TEEP
Identify underutilised shifts and increase production during idle periods.
Balance workloads across multiple shifts to optimise machine availability for better production planning.
Use historical production data to plan for demand fluctuations.
Increase Production Speed and Quality
Identify slow-running equipment and adjust performance parameters.
Reduce defect rates by implementing quality control measures in real time.
Use automated data collection to analyse performance trends.
Best thing about it is that you do not have to do all of this manually. GlobalReader has an easy to use software and to give you an idea of how simple it is we’ve made it FREE to try out. All you need is to sign in with google or create a demo account and start playing around. You can see what causes downtime, plan maintenance and much eventually rely on acutal real-time data to star making better desicions and start earning more money.