

Smart LiveView · add-on for the Monitoring Core
Visual factory on any TV: whatever your floor needs to see, live
Smart LiveView turns any factory TV into a live board of what matters to your factory: output against target, which machine is down and why, the monthly target, your OEE if you work with it, the temperature in every cold room. The same numbers the machines are producing, the moment they produce them, so the fix happens on this shift, not in tomorrow's meeting.
- You choose what the board shows
- Runs on any Android TV
- €13 per machine per month
Smart LiveView isn't switched on for your account yet
Put your floor on the wall
Your machines already send their data to GlobalReader. Smart LiveView turns it into a live board on any Android TV, showing whatever your floor should see: output against target, stop reasons, the monthly target, OEE if you use it, the finish time at the current pace. No new hardware and no setup project.
€13 per machine per month, added to your current plan.
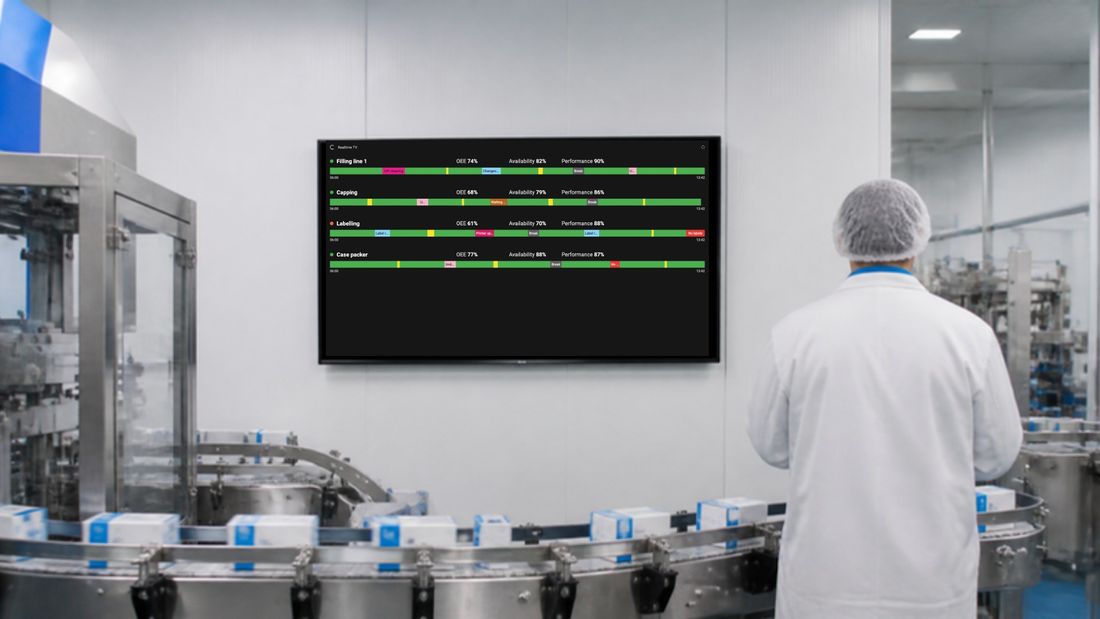

What goes on the board is up to you
Smart LiveView is GlobalReader's visual factory software, the live screen for the shop floor. It shows, on any TV, tablet or browser, whatever data matters to your factory: live OEE gauges for the shift, OEE for every day of the month against target, the stop reasons ranked by minutes lost, this shift next to the last one, order progress against the plan, every machine on one timeline, the floor plan with room temperature pinned to it. Pick a ready-made view or have one designed around what you want to show. There is nothing to type in and nothing to estimate: the board shows what the machines are doing right now.
Live OEE gauges for the shift
OEE, availability, performance and quality on four gauges, with the production graph underneath. A sawmill runs it per line, counted in metres.
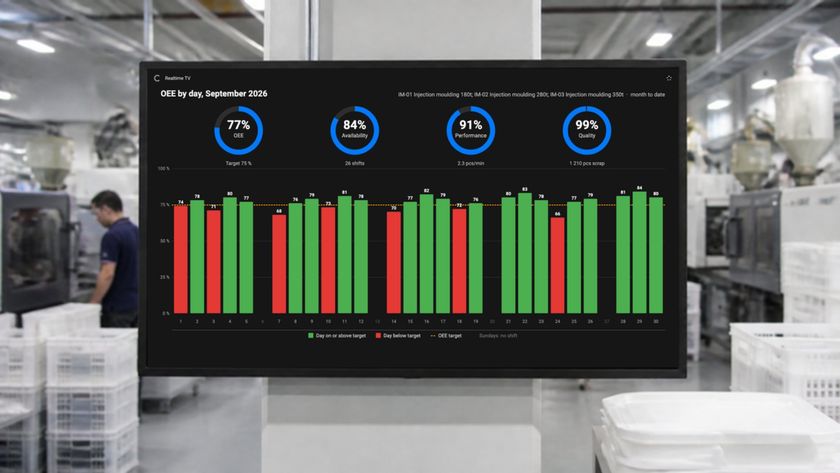
OEE for every day of the month
Each day green or red against the target, with the month's averages on the same gauges. The monthly target, on the canteen TV for the whole team.
Stop reasons ranked by minutes lost
The top 10 interruptions by total minutes, the time spent in each stop group, or the week's stops with their durations.
This shift next to the last one
Previous and current shift side by side, with the stops and the productivity line, and productivity, utilisation and OEE as the three headline figures.
Utilisation per line, for one group of lines
Only the lines one team runs, shown as utilisation rather than OEE, with each line's undefined stop time for the bonus period.
Every machine on one 24-hour timeline
All machines on one timeline, with availability and OEE for the last three days, filtered by date and shift.
Order progress against the plan
Due date, days left, pieces done of planned, the live speed on a speedometer, and a green or red light: fast enough to meet the deadline, or not.
The floor plan, every station pinned
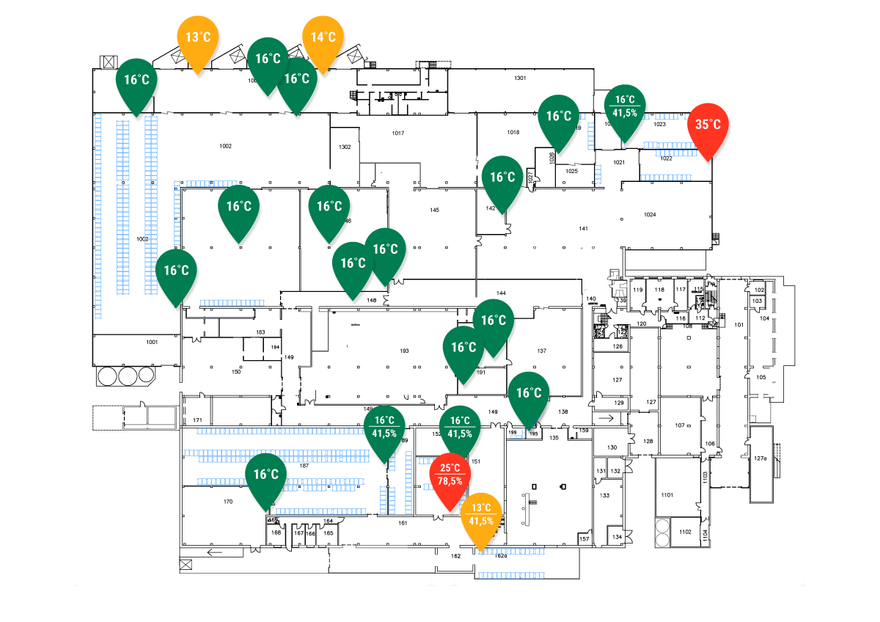
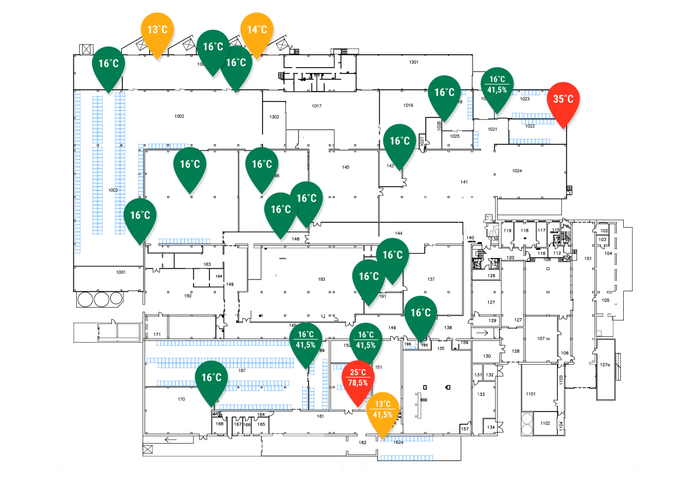
One site or several, each workstation with its live status, and room temperature and humidity pinned to the plan. A dairy runs its cold chain on it.
A live quality split
A, B and C grade counts as they happen, or quality worked out from the scrap reasons where grading is not automatic.
And anything else GlobalReader records: any report or graph from Analytics can go on a screen, from the library or designed around what you want to show.
How the numbers get to the screen
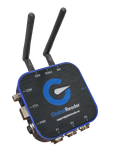
The machine signal
Scoutbox counts pieces, metres, cycles, run time, temperature or whatever the sensor reads, on any machine. The operator adds the reason when it stops.

GlobalReader
Turns the signals into the numbers you chose to show: output against target, status, stop reasons, OEE, the finish time at the current pace, as they happen.
Any screen in the factory
An Android TV on the hall wall, a tablet at the line or a browser in the office. The board updates the moment the machine does.
Sound familiar?
Right now, nobody on the floor knows if today is going well.
The status is visible in one place on the floor, and nowhere else.
I'd like the workers to see it too, not just me.
A machine stood for twenty minutes before anyone noticed.
The real numbers live in a report we read tomorrow.
The machines already know; the information just reaches people too late to matter. Smart LiveView puts it on the wall during the shift, where tomorrow's report cannot.
Pick the workstations, the numbers and the layout
A visual factory needs more than one screen, because the operator, the shift lead and the manager watch different things. Each Smart LiveView screen gets its own view: one from the library built up from what other factories asked for, or one designed around what you want to show.
The line board: output against target
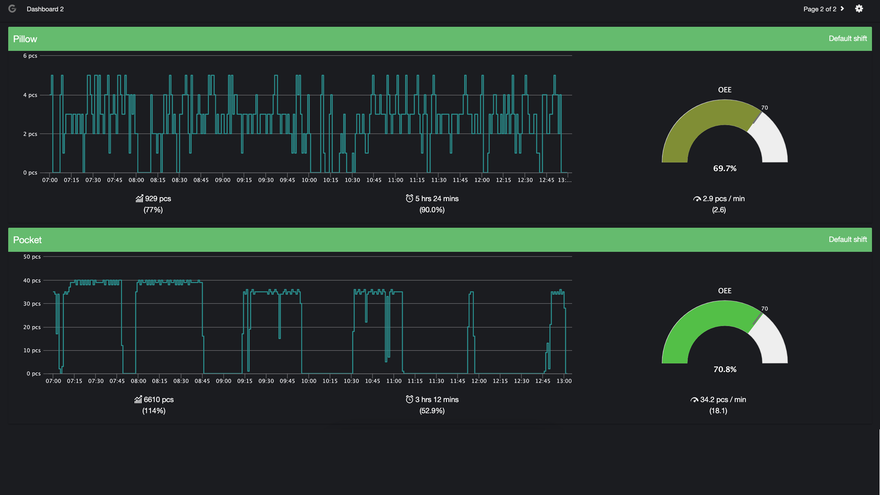
Pieces per minute this shift, a running count against the target, and here an OEE gauge next to it. A display for the people running the line: four or five live elements and no more, so a slipping target is seen at 11:00, not at the shift-end post-mortem.
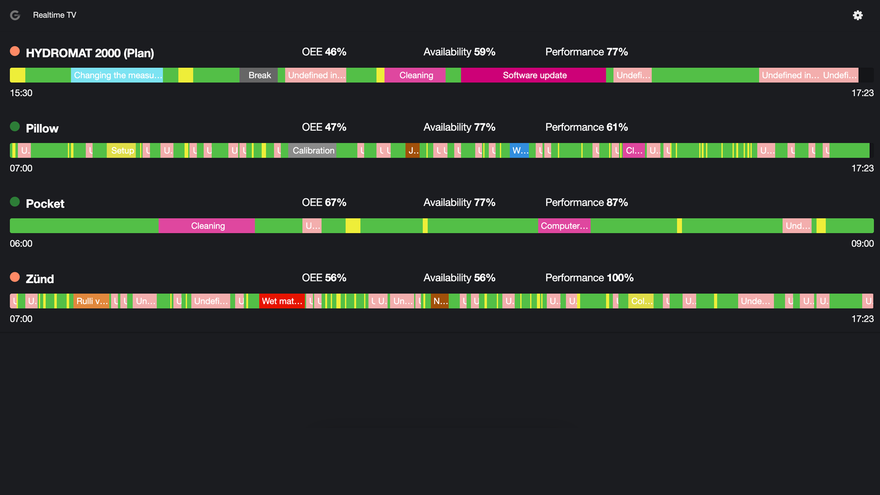
The digital production board: every line, one timeline
Several lines at once, each with its OEE, availability and performance, and the colour-coded shift timeline underneath. This is the shop floor dashboard that goes on the hall wall or in the canteen, so the whole team sees the same number and the previous shift's result next to it.
The floor plan: your factory, with every station's status pinned
Upload your layout and pin the workstations. The whole floor is on one screen, green where it runs and red where it does not. The same view carries room temperature and humidity, which is how a dairy runs its cold chain on it: 21 locations on one TV, with an SMS when a reading drifts.
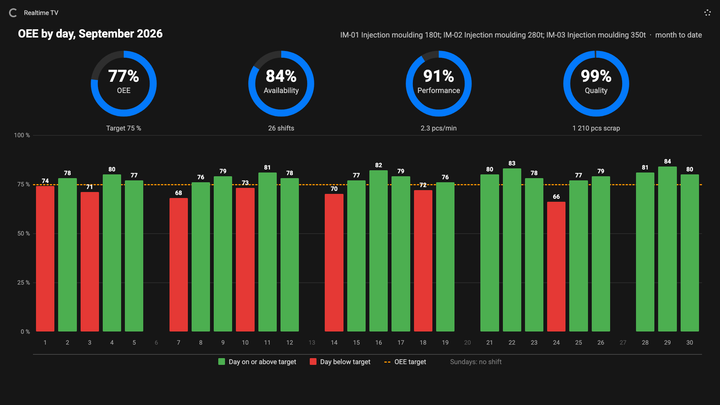
OEE for every day of the month
Each day green or red against target, the month's averages on four gauges. Days without a shift are left out.
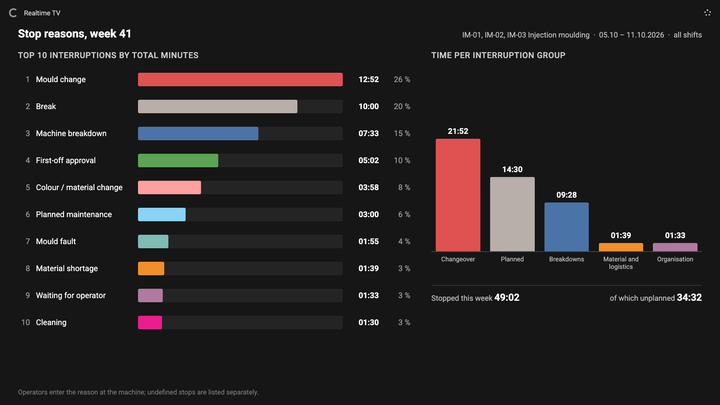
Stop reasons ranked by minutes
The top 10 interruptions of the week by total minutes, or one column per stop group.
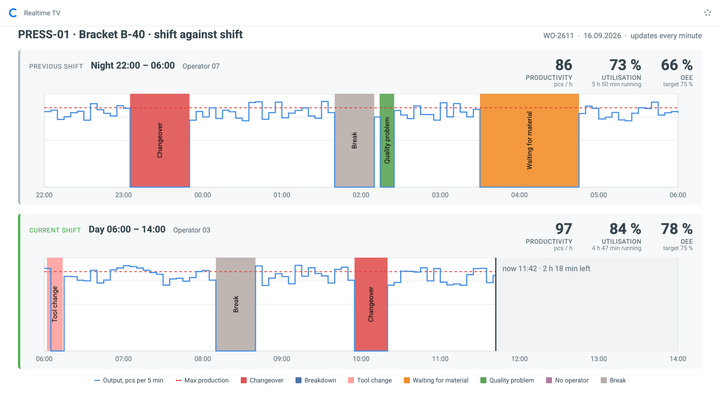
This shift next to the last one
Two shifts side by side, with productivity, utilisation and OEE as the headline figures.
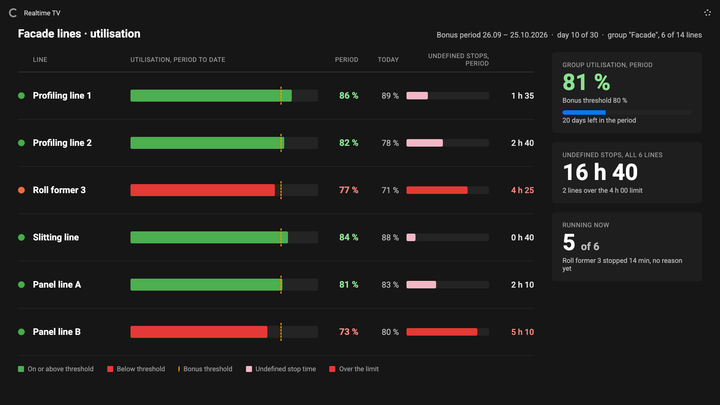
Utilisation for one group of lines
Only the lines one team runs, as utilisation rather than OEE, with each line's undefined stop time for the bonus period.
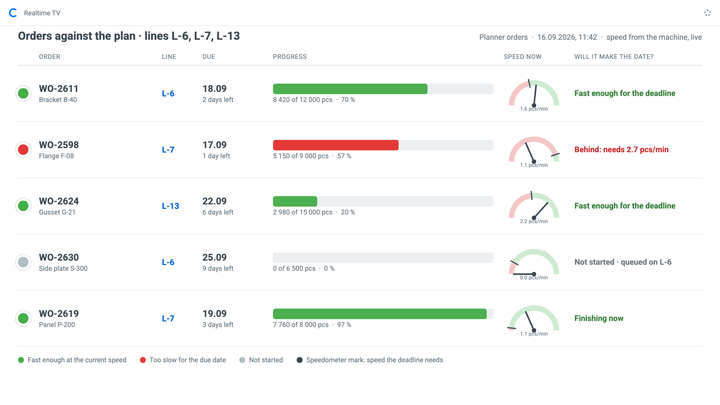
Order progress against the plan
Orders with due date, days left and a progress bar, the live speed on a speedometer, and a green or red light for "fast enough".
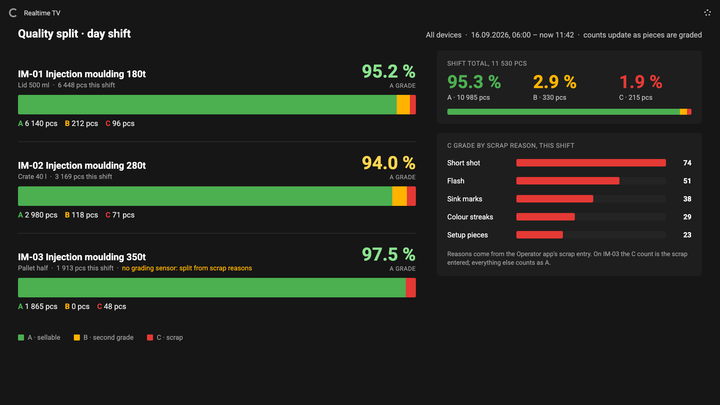
A live quality split
A, B and C grade counts as they happen, or quality worked out from the scrap reasons.
A library of ready-made views, or one designed for you. One to six panes per window. Any period, this shift or last month. One machine, one line, or several plants. Your logo and colours.
A number you read tomorrow can't change today's output
Reports are for learning; a live board is for reacting. When the team sees a stop the moment it starts, and sees the target slipping while it is still catchable, the response happens on shift. Monitoring only turns into improvement at that point.
- +27.4%average OEE improvement
- +22.8%availability improvement
- €39,200recovered per machine per year
Averages across 184 GlobalReader factories. The recovered hours come from stops that got a same-shift reaction instead of a next-day explanation.
If you can mount a TV, you can install it
Smart LiveView is an Android app that runs on any Android smart TV or Android device, and in a browser on any screen. There is no PC behind each display and nothing to wire or integrate, because it shows the data your machines already send through GlobalReader.
On a floor GlobalReader already monitors, a new screen is live in minutes. On a floor that is not monitored yet, connecting the machines takes about 90 minutes per machine, and the board comes with them.
- Android TV or any Android device
- A browser on any PC screen
- Servers in Europe, on-premise available
- Readings buffered end to end
Built for the factory floor
A scoreboard the whole shift can read
The board shows the work and the goal. It has no view of the person. Operators can see they are ahead of target and prove it, and they can raise a problem the moment it happens.
- One number the whole shift agrees on, instead of every shift reading a different scoreboard.
- Faster reaction to stops, because everyone sees them the moment they happen.
- A fairer picture of the work: the screen shows what is running, not who to blame.
- Nothing to fill in: the board reads the machines, and the operator adds only the reason for a stop.
The hours you win back come from reacting on shift, and that only happens when the floor can see what is going on.
€13 per machine per month. That's the whole line item.
Smart LiveView is an add-on to the GlobalReader Monitoring Core, the live machine data the board runs on. The price does not change with the number of screens or users, and there are no tiers.
€13
per machine per month
Added to the Monitoring Core: €125 per machine per month, with the Scoutbox, sensors, Analytics, notifications and support included.
Pay yearly in full and save 5%.
Book a demoMaintenance-led team? Smart LiveView is also included in Maintenance Premium, €240 per factory per month.
What you get
- Any data GlobalReader collects, live on screen
- Ready-made views, or a view designed around what you want to show
- Output against target, pace, status and stop reasons
- OEE, availability and performance per line, if you use them
- Shift timeline with every stop coloured and labelled
- Floor plan view with pinned workstations and room readings
- Finish time at the current pace
- Unlimited screens, any Android TV or browser
At €100 or more an hour of factory time, one stop caught ten minutes sooner each day covers the add-on many times over. GlobalReader factories recover on average €39,200 per machine per year.
Calculate your factory savings- +27.4%
- Average OEE improvement
- +22.8%
- Availability improvement
- €39,200
- Recovered per machine per year
- 200+
- Factories monitored across Europe
How are GlobalReader customers using Smart LiveView
Twenty-one cold rooms on one TV, and an audit met on time
With an audit approaching, Tere Põlva needed temperature and humidity records across 21 locations, some running as cold as −50 °C. Every sensor was mapped onto a Smart LiveView board of the factory layout, so the team could see each area's conditions live on one screen, with an SMS to the technical manager the moment a reading crossed its limit. The manual warehouse rounds stopped, and the audit was met on time.
Read the Tere Põlva story"The operators are very diligent in logging comments that I can then direct straight to the production side or the technical side."
"Operators want to talk. Now we see the interruptions they mark, and we ask: what should we do about this? It's very good for both sides."
Factories running GlobalReader







Smart LiveView questions
The questions production managers and shift leads ask us most. Something missing? Ask us directly.
What does Smart LiveView show?
Whatever matters to your factory, live. The boards customers ask for most: OEE, availability, performance and quality gauges for the current shift with the production graph; OEE for every day of the month, green or red against target; stop reasons ranked by minutes lost; the current shift next to the previous one; utilisation per line for one group of lines; every machine on one 24-hour timeline; and order progress against the plan with a green or red light for "fast enough". Add the floor plan with every workstation's status and room temperature, or a live quality split. You pick the workstations, the numbers and the layout for each screen.
Is it only for OEE?
No. OEE is one of the things a board can show, and some factories never put it on the wall. A packaging line shows pieces against the shift target, a canteen screen shows the monthly target for the whole team, a dairy shows the temperature of every cold room. The board shows the numbers your people act on.
Can we design our own view?
Yes. Start from the library of ready-made views, built up from what other factories have asked for, such as a simple dashboard, a stop overview, a line board or the floor plan. If none fits, a view is designed around exactly the information you want on that screen; that is a small, quoted piece of work, and most of the boards on this page started that way. Each screen gets its own TV link.
What is real-time OEE?
Real-time OEE is availability × performance × quality calculated continuously from live machine signals, instead of entered after the shift. GlobalReader reads every machine through Scoutbox, so a Smart LiveView board can show each line's OEE as it moves, next to the output and the stop reasons. How OEE is calculated.
What is the difference between a live board and an end-of-shift report?
Reaction versus explanation. A report tells you what was lost; a live board shows the loss while there is still shift left to recover it. A machine that stops at 10:00 turns red on the board at 10:00, not in a spreadsheet after lunch. What an OEE dashboard should show each role is covered in our guide.
What should the operator, the shift lead and the manager each see?
The operator sees the line board: output against target, pace and the line's OEE, four or five live elements and no more. The shift lead sees the multi-line board with every line's OEE and the shift timeline. The manager sees the floor plan with every workstation's status. Each is a separate screen, and all three run on the same data.
Can it show yesterday's results, or the monthly target?
Yes. Views are configurable, with one to six panes per window and any period, so one screen can show this shift live and yesterday's result next to it. Many factories put one board on the hall wall and one in the canteen, with the monthly target and progress for the whole team.
Can it show order progress against the plan?
Yes. A board can list the orders from Planner with the due date, the days left and a progress bar of pieces done against planned, next to the live speed of the line on a speedometer and a green or red light: fast enough to meet the deadline, or not. One factory runs it across three lines that share the same orders.
Can it compare this shift with the previous one?
Yes. One board shows the previous and the current shift side by side, each with its stops and its productivity line, and productivity, utilisation and OEE as the three headline figures. The incoming shift sees what it inherited; the outgoing one sees how it finished.
What hardware do I need?
A screen. Smart LiveView runs as an app on any Android smart TV or Android device, and in a browser on any PC screen. There is no PC behind each display, no wiring and nothing new to integrate: it shows the data your machines already send through GlobalReader.
Does it work with old machines?
Yes. The board shows whatever GlobalReader monitors, including decades-old machines read through a Scoutbox with a photo-eye, inductive or current sensor. How Scoutbox reads a machine.
Is this an andon system?
It is the visual half of one: machine status on a screen, the andon board without the board. Together with Call for Help, the operator's one-tap call to a foreman or mechanic by SMS or email, and automatic notifications when a machine has been stopped longer than a limit you set, it forms GlobalReader's virtual andon. What an andon system is.
Can it show temperature and humidity too?
Yes. The floor-plan view carries the readings of room sensors and turns a point red when one drifts out of range. That is how a dairy runs its cold chain on it: 21 locations, some at −50 °C, on one TV, with an SMS when a limit is crossed. Read the Tere Põlva story.
Will operators feel watched?
The board shows machines and targets, not people. Teams use it to see they are ahead of target and to prove it, and to raise a problem the moment it happens.
Can cameras be connected to Smart LiveView?
No. Smart LiveView shows production data from the machines, not video.
How much does it cost, and how fast is setup?
€13 per machine per month as an add-on to the GlobalReader Monitoring Core (€125 per machine per month, hardware included). The price does not change with the number of screens, and there are no tiers. On a floor GlobalReader already monitors, a new screen is live in minutes; a floor that is not monitored yet takes about 90 minutes per machine to connect.
See your own floor live on a board
We will show a board running on real machine data, and the kind of stop you would have caught this shift.