
Downtime is any period when production equipment is unavailable for work. The useful question is whether the stop was planned or unplanned. Planned downtime protects the line by creating space for maintenance, upgrades, inspections, and changeovers. Unplanned downtime interrupts the line and forces your team to react while production targets slip.
This guide keeps the focus on planned downtime, but it starts with the comparison because both types affect OEE, schedule reliability, and customer promises.
Planned vs Unplanned Downtime: What’s the Difference?
Planned downtime is a deliberate, scheduled stop. Unplanned downtime is an unexpected stop caused by a breakdown, material issue, power loss, or another disruption. The key activities during planned downtime include preventive maintenance (replacing worn parts before they fail), equipment upgrades (installing new software or hardware), quality inspections, and changeovers between product runs.
| Tag | Use it for | Examples |
|---|---|---|
| Planned | Legally required or pre-agreed scheduled time loss | Lunch break, statutory rest break |
| Unplanned | Anything that interrupts production flow or takes longer than agreed | Tool change, cleanup outside the agreed window, product changeover, meeting, waiting for material, urgent repair |
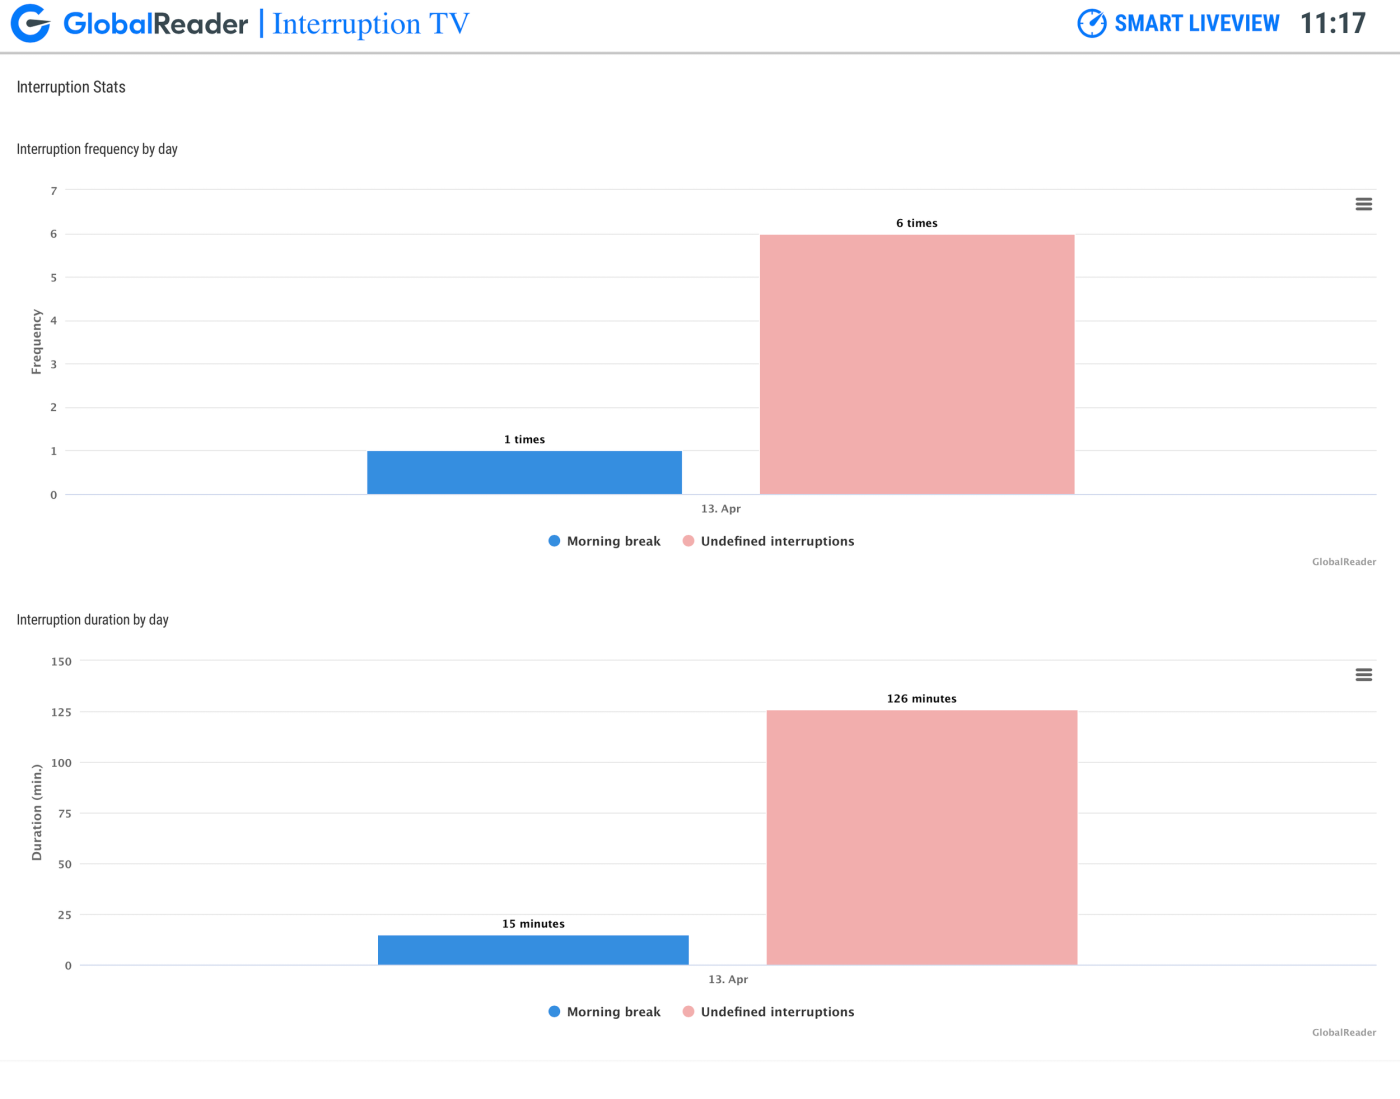
What is Planned Downtime?
Planned downtime is when you deliberately take production equipment offline for maintenance, upgrades, testing, repairs, inspections, or changeovers.
Because planned downtime is scheduled in advance, you control when the stop happens, who needs to be involved, and what should be ready before production pauses.
Common planned downtime examples include:
Preventive maintenance: Replacing worn parts before they fail during production.
Equipment upgrades: Installing new hardware, software, or machine improvements.
Quality inspections: Checking machinery, tools, or settings before defects appear.
Product changeovers: Switching a line from one product, format, or batch to another.
Planned downtime still costs production time, so it should be measured and improved. A planned stop that runs long can create the same pressure as an unexpected failure.
Are Planned and Scheduled Downtime the Same?
Yes. Planned downtime and scheduled downtime usually mean the same thing in manufacturing. Both describe a stop that is expected before production pauses. The small difference is wording. “Scheduled downtime” points to the calendar slot, while “planned downtime” points to the interruption reason and preparation behind the stop.
For example, a Sunday maintenance window is scheduled downtime because it has a set time. It is planned downtime because the team prepared the task, spare parts, people, safety checks, and restart steps in advance.
If a stop is not prepared or logged clearly, do not hide it under scheduled downtime. Treat overruns separately so the team can see what ran long and why.
Why Planned Downtime Matters for Manufacturers
Planned downtime keeps maintenance, cleaning, changeovers, and inspections from turning into surprise production losses. The point is to choose the stop, prepare for the stop, and restart on time.
Planned downtime matters because it gives teams a controlled window to:
Prevent failures: Maintenance can replace worn parts before a breakdown stops the line.
Protect output: Production can schedule work around the stop instead of reacting mid-shift.
Improve safety: Technicians can work with the right lockout, tools, and instructions.
Improve planning: Managers can compare planned duration with actual duration and fix repeat overruns.
Good planned downtime does not mean accepting lost time. It means knowing which stops are necessary, how long they should take, and whether the factory is getting better.
What is unplanned downtime?
Unplanned downtime is any production stop that happens outside the schedule. The line should be running, but something prevents work from continuing.
Unplanned downtime can include:
Breakdowns: A machine, tool, or component fails during production.
Micro-stops: Short stops repeat often enough to reduce output, even when nobody writes them down.
Material waits: Operators are ready, but parts, packaging, pallets, or raw materials are missing.
Missing operators: The machine is available, but the right person is not at the station.
Late response: A stop happens, but maintenance, supervision, or support arrives too late.
The damage comes from the delay between the stop and the response. If teams log the reason after the shift, the data often becomes a guess.
The dirty secret: “planned” downtime that isn’t
Some planned downtime creates the same visibility problem as unplanned downtime. A maintenance stop expected to take 1.5 to 2 hours can become 4 hours when nobody measures the planned stop properly.
That overrun usually does not come from one big mistake. It comes from small gaps before, during, and after the stop:
No baseline: The team knows the scheduled time, but not the normal actual time.
Weak handover: Production and maintenance do not agree on what must be finished before restart.
Parts and tools not ready: Technicians lose time looking for items that should have been prepared.
Cleaning and setup mixed together: Teams cannot see which activity caused the delay.
Late operator logging: The event gets recorded after the fact, so the reason code is vague.
This is why planned versus actual data matters. If maintenance says the stop was scheduled and production says output was lost, both teams need the same timeline before they can improve it.
Data collection methods for accurate calculations
Manual tracking can work as a starting point, but the method must be consistent across shifts.
Stopwatch method: Record the start and end time of each planned stop, then total the minutes.
Deduction method: Subtract actual run time from planned production time to find total downtime.
Interruption reason-code method: Record the stop type, reason, machine, order, operator, and restart time.
The problem with paper and spreadsheets is delay. Operators often log downtime after production restarts, which makes planned stops, overruns, and unplanned breakdowns harder to separate. It’s industry 4.0 and factories should all use a proper downtime tracking software to make their life easier.
Distinguishing planned versus unplanned in calculations
Planned stops such as changeovers, breaks, planned maintenance, and cleaning are frequently excluded from downtime calculations and accepted as inevitable losses
Shutdowns (scheduled or not) can consume up to 1%-10% of available production time
We’ve said it before and will say in the future - you cant measure what you can’t see. But to see, that means team effort. A culture change, if you will.
How to Optimize Planned Downtime in Manufacturing
The key is balancing three things: timing your shutdowns to minimize production impact, focusing on equipment that matters most, and using actual performance data to decide how long maintenance should take. When you get this right, you shift from reactive firefighting to proactive maintenance that actually prevents the expensive breakdowns. You also maintain safer working conditions because technicians aren’t rushing emergency repairs under pressure.
Optimizing planned downtime requires scheduling maintenance during off-peak hours, prioritizing high-impact equipment, and using real-time data to determine the optimal duration for each shutdown.
Prioritize Equipment Based on Impact
Not all equipment deserves equal attention. Focus on bottleneck machines first (the ones that limit your overall throughput), then critical single-point-of-failure assets. If your CNC machine breaks, the entire production line stops. If a secondary conveyor goes down, you can often route around it.
Use your production flow data to understand cascading impacts. When one machine fails, which downstream processes get starved for work? That’s your criticality ranking. Allocate your maintenance resources and spare parts inventory based on this hierarchy. GlobalReader’s OEE tracking shows you exactly which machines have the highest downtime costs and performance losses, so you’re not guessing about priorities.
Prioritize equipment maintenance based on production impact, focusing first on bottleneck machines and critical assets that affect overall throughput and cause the most costly disruptions when failing.
Turn Planned Downtime Into Your Advantage
Use Real-Time Data to Determine Optimal Duration
Stop scheduling maintenance based on arbitrary calendar intervals. Real-time monitoring tells you when equipment actually needs attention based on performance degradation, vibration patterns, temperature anomalies, or cycle time creep. If your machine is still running at 98% of optimal performance, you don’t need to shut it down yet.
Predictive analytics help you estimate how long maintenance will actually take. Historical data on similar repairs shows you that bearing replacements typically take 4 hours, not the 8-hour buffer you’ve been scheduling. You can also see which maintenance tasks consistently run over their estimates so you can adjust.
Integrated systems like GlobalReader have maintenance features included or connect your OEE data with your maintenance management software from one of our partners. When performancedrops below a threshold, the system automatically flags the equipment for the next available maintenance window and suggests the optimal duration based on past interventions. This eliminates guesswork and prevents both premature maintenance (wasting capacity) and delayed maintenance (risking breakdowns).
Real-time production data reveals actual equipment performance patterns and maintenance needs, enabling manufacturers to calculate the precise duration needed for maintenance without excessive buffer time that extends unnecessary downtime.
Cutting unplanned downtime starts with knowing why
Reducing unplanned downtime starts with reason capture at the source. Operators need a simple way to record why production stopped while the event is still fresh. Do not wait until the end of the shift and ask people to remember what happened. That turns downtime analysis into guesswork.
Keep this section simple:
Capture the stop automatically: Machine state data shows when production stopped and how long the loss lasted.
Ask for the reason immediately: Operator input adds the missing context, such as jam, material issue, setup delay, or waiting for maintenance.
Review the pattern later: Production and maintenance can then see repeat losses without arguing over whose numbers are right.
That first step is enough for this stage. The detailed work on reason codes, maintenance strategy, and reduce-downtime tactics belongs in the dedicated downtime analysis sections.
What to Do After Planned Downtime
The maintenance work is finished when the machine proves it can run as expected. Use the first restart to validate output, capture operator feedback, and check whether planned downtime reduced future losses.
Run tests before full production
Don’t just flip the switch and hope everything works. Run systematic tests that match the type of maintenance you performed. If you replaced a bearing, check vibration levels and temperature. If you updated PLC software, verify all automated sequences execute correctly. Compare the results against your baseline performance metrics and OEM specifications.
Operators know when something feels off, even if the numbers look fine. Create a simple feedback process where machine operators report unusual noise, vibration patterns, temperature changes, or cycle time variations during the first production run. A centralized system like GlobalReader lets you log this feedback directly alongside your OEE data, so you can spot patterns across multiple maintenance events.
Measure impact and ROI
Track specific metrics before and after planned downtime to calculate the actual return on your maintenance investment. Start with your baseline OEE score from the week before maintenance, then measure OEE for the week after. If your bearing replacement increased availability from 82% to 91%, that’s a 9-percentage-point gain you can convert to additional production capacity. We have a full guide for the oee calculation.
The unplanned downtime ratio tells you if your planned maintenance is actually preventing breakdowns. Calculate it by dividing unplanned downtime hours by total downtime hours. If this ratio drops from 40% to 25% after implementing condition-based maintenance, you’ve reduced emergency repairs significantly.
Don’t forget the financial impact. Calculate capacity utilization gains by multiplying your OEE improvement by your production value per hour. A 5% OEE increase on a line producing €500 worth of product per hour equals €25 per hour in recovered capacity. Over a year, that’s substantial. Also track working capital improvements since better equipment reliability means you can reduce safety stock levels.
For more in depth explanation of this topic in general, see this post about downtime.
Optimize Planned Downtime with GlobalReader’s OEE Software
GlobalReader’s OEE software takes the guesswork out of planned downtime scheduling. Instead of relying on fixed maintenance calendars or gut feeling, you get real-time production data that shows exactly when your equipment needs attention and when downtime will have the least impact on output.
The system continuously monitors machine performance, tracking availability, performance rates, and quality metrics. When you’re planning maintenance, you can see which production windows have the lowest order volume or which shifts typically run below capacity. This means you can schedule downtime during natural gaps rather than interrupting high-value production runs.
See the workflow yourself
Try the free demo to see downtime tracking with sample production data. No financial commitment needed. Sign in with Google or create a free account and take the tour.
FAQ about Downtime
1. What is planned downtime in manufacturing?
Planned downtime is any period when production equipment is intentionally taken offline in advance. Common reasons include preventive maintenance, equipment upgrades, product changeovers, quality calibrations, operator training, and scheduled breaks. Unlike unplanned downtime — which stops production without warning — planned downtime lets you coordinate with your production schedule, prepare spare parts, and alert your team in advance so disruption is kept to a minimum.
2. What is the difference between planned and unplanned downtime?
The key difference is control. Planned downtime is scheduled in advance — you choose when it happens, how long it lasts, and who is involved. Unplanned downtime happens without warning, typically due to equipment failures, material shortages, or operator errors, and it disrupts your entire production flow. Research shows that unplanned stops take 3–9 times longer to resolve than planned maintenance windows, and emergency repairs can cost 3–5 times more than the same work done proactively. For metal, food, wood, and plastics factories, even a few hours of unplanned downtime can mean tens of thousands of euros in lost output.
3. How much does manufacturing downtime cost per hour?
Downtime costs vary by industry and production volume. For wood and panel production, GlobalReader data puts the figure at roughly €10,000–12,000 per hour. Food and beverage operations typically face €5,000–15,000 per hour, while metal fabrication and machining ranges from €3,000–10,000 per hour. These figures cover direct production losses, idle labour, wasted materials, and emergency repair costs — but they exclude the harder-to-measure damage to customer relationships and team morale. For a small or mid-sized factory experiencing 20–30 unplanned stops per month, the annual cost can easily reach hundreds of thousands of euros.
4. Does planned downtime affect OEE (Overall Equipment Effectiveness)?
In standard OEE calculation, planned downtime is excluded from the base — meaning it does not directly reduce your OEE score. However, this does not mean planned downtime is free. It still eats into your available capacity, and if changeovers or maintenance windows routinely run longer than expected, that overrun counts as unplanned time and does reduce OEE. The right approach is to set a realistic time limit for each planned activity, exclude that limit from OEE, and track anything over the limit as unplanned loss. GlobalReader makes this easy by capturing both machine data and operator-logged reasons in real time, so you always know whether a stop was planned or an overrun.
5. What causes the most unplanned downtime in factories?
The most common causes are equipment failures (worn bearings, electrical faults, hydraulic leaks), operator errors and training gaps, material shortages or late deliveries, and micro-stops that are too brief to trigger an alarm but add up to 5–15% hidden production loss over a shift. Many factories also suffer from poor downtime visibility — stops are logged on paper or from memory at the end of a shift, so the real root causes stay hidden. GlobalReader connects IoT sensors directly to your machines and gives operators a simple touchscreen to log the reason the moment a stop happens, turning vague "downtime" data into actionable patterns.
6. How can I reduce unplanned downtime in my factory?
The single most impactful first step is real-time visibility — you cannot fix what you cannot see. Once you know exactly when, where, and why stops occur, three strategies deliver the biggest results: (1) Shift from reactive to preventive or predictive maintenance, which typically reduces unexpected breakdowns by 30–50%; (2) Invest in operator training so your team can spot early warning signs and log issues immediately; (3) Improve spare parts and inventory management so critical components are always on hand. GlobalReader bundles all of this into one subscription that includes the hardware sensors — no separate hardware purchase needed — making it one of the most cost-effective solutions available compared to alternatives like MachineMetrics., Evocon or Factbird.
7. What is preventive maintenance and how does it reduce downtime?
Preventive maintenance means servicing equipment on a regular schedule before failures occur — replacing worn parts, lubricating components, calibrating sensors, and checking for early degradation. Done correctly, it reduces unexpected breakdowns by 30–50%, extends equipment lifespan, and allows you to plan maintenance during low-demand periods when parts and technicians are already prepared. GlobalReader's Maintenance feature lets you schedule tasks based on real-time machine data, manage unlimited devices from a single dashboard, automate spare-parts reorder alerts, and give technicians clear daily schedules with automatic notifications — turning what would be emergency stops into routine maintenance windows.
8. How do I calculate the cost of downtime in my factory?
Use this formula: Downtime Cost = (Lost Production Units × Profit per Unit) + Fixed Costs During Downtime. Fixed costs include idle labour wages, spoiled materials, electricity and heating, emergency repair expenses, and any overtime needed to recover lost output. For example: a line producing 100 units per hour at €50 profit per unit loses €20,000 in output alone during a 4-hour stop — before adding €1,000 in idle labour, €2,000 in repair costs, and €1,050 in recovery overtime. That is €24,050 for a single 4-hour incident. When you track these numbers consistently with GlobalReader's real-time dashboards, the business case for proactive monitoring becomes impossible to ignore.
9. What hardware do I need to monitor machine downtime?
Most production monitoring solutions sell software and hardware separately, which means significant upfront investment and complex installation projects. GlobalReader takes a different approach — hardware sensors are included inside the subscription price. You get IoT sensors that connect to any machine regardless of age or brand, a touchscreen operator interface, and a cloud management dashboard, all for one monthly fee. This makes GlobalReader significantly more affordable to implement than hardware-plus-software competitors, and it works across metal, food, wood, and plastics production environments without requiring a full MES replacement.
10. Can operators help reduce downtime, and how?
Operators are your first and best line of defence against downtime. They see every micro-stop, adjustment, and early warning sign — but that knowledge often stays on the shop floor unless there is a simple, real-time way to capture it. When operators can log a stop reason immediately on a touchscreen (material shortage, tool change, quality issue, equipment fault), generic "machine stopped" data becomes root-cause intelligence. GlobalReader's Operator interface is built specifically for this: it is fast, visual, and requires no IT training. Factories using this approach typically see unplanned interruptions drop by 10–15 percentage points within the first few months, as patterns become visible and targeted fixes become possible.