

Real-Time Production Data in Manufacturing: A Production Manager's Guide (2026)
Most factories run at 55-60% OEE. That means 40-45% of potential output is already lost, and shift-end paper reports add another 8-12 hours of blind spots before anyone can act. Real-time production data closes both gaps and benchmarks consistently put throughput losses at 20-30% of potential output, driven by downtime, speed losses, and scrap. The shift report captures what happened, not what's happening. Real-time production data changes that. It surfaces machine states, output counts, and quality issues the moment they occur, so teams can act while there's still time to recover.
This article covers what real-time production data actually is, which categories matter, and why it's central to OEE improvement and smarter decision-making on the shop floor.
See where your factory is losing output right now. Try the free demo. Sign in with Google, no financial commitment.
Summarize with AI
What Real-Time Production Data Actually Means
Real-time production data is automated, live information captured directly from machines and sensors on the factory floor as manufacturing events occur. It is the operational core of Industry 4.0 on the shop floor.
It covers machine availability, performance rates, quality output, cycle times, and production order progress.
Every metric updates as events occur on the shop floor, not on a report schedule.
When sensor data connects to ERP production orders, you see immediately how each job tracks against its target. A cycle time deviation or scrap spike appears against the specific order it affects.
Most manufacturing facilities run at 55-60% OEE, meaning 40-45% of potential output is already lost. When production reports only arrive at shift end, those losses grow before anyone can act.
Operators with live performance metrics on their own screens can adjust without waiting for a supervisor update.
A rising reject rate or cycle time drift prompts immediate correction, not a post-shift debrief.
Real-Time vs. Near-Real-Time vs. Historical Reporting
Real-time data updates in seconds, near-real-time in minutes, and historical data covers past periods. Each mode serves a different decision speed.
Plenty of manufacturing dashboards refresh every 1-5 minutes and label this as 'live.' That qualifies as near-real-time, not true real-time, but the distinction rarely appears in product marketing.
Check the actual polling interval before assuming true real-time.
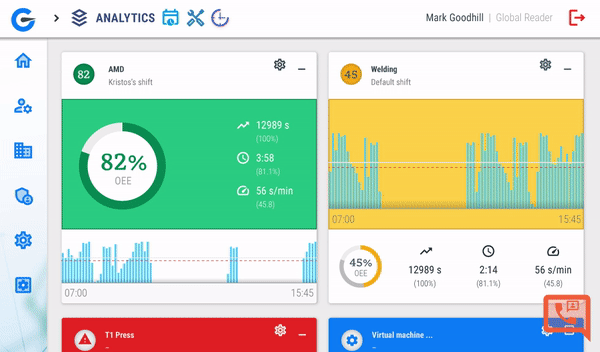
GlobalReader's Smart Live View shows OEE and machine status as events happen on the floor. Updates are sensor-driven and continuous, with no polling interval between what the machine does and what the screen shows.
Watch out for this when comparing platforms: many vendors label 1-5 minute refresh dashboards as live or real-time. For most shop floor decisions this is fine, but if you are tracking fast-cycle machines, check the actual polling interval before you buy.
| Mode | Update speed | How it works | Best for | Decision unlocked |
|---|---|---|---|---|
| Real-time | Sub-second to seconds | Sensor stream pushed to dashboard | Operator response, alarm triggering, OEE counters | Stop a stoppage in progress |
| Near-real-time | 30 sec to 5 min | Polled refresh, batched updates | Shift dashboards, shop-floor TVs | Spot a trend within the shift |
| Historical | Hours to days | Shift-end reports, ERP rollups | Weekly and monthly reviews | Capacity planning, root cause |
The 5 Core Categories of Production Data to Track
Not all production data carries the same weight. Five categories drive the biggest impact on OEE and shop floor decisions.
1. Equipment Performance (OEE)
OEE multiplies Availability (uptime), Performance (production speed), and Quality (good units produced) into one score showing how effectively a machine runs. OEE is defined under ISO 22400, the international standard for manufacturing operations KPIs.
OEE = Availability x Performance x QualityExample: 90% uptime x 95% speed x 98% quality = 83.8% OEEWorld-class manufacturers run at 85%+. Most run 55-60%.
For a deeper look at one of OEE's three components, explore our guide to machine availability in OEE.
2. Downtime and Stoppages
Large industrial plants average 25 unplanned downtime incidents per month, down from 42 per month in 2019. Automated tracking of micro-stoppages lasting 30 seconds to 2 minutes improves OEE by 10-30% in packaging, automotive, and pharmaceutical sectors. Manual logs miss these short stops entirely.
*Of these five, micro-stoppage tracking delivers the fastest ROI for most factories. It is also the last category most teams implement.*
3. Quality Output
First-pass yield, scrap rate and rework rate captured per machine, per order and per operator. When a defect spikes, you want to know whether it is a machine, a material lot or a shift pattern within minutes. To act on quality data effectively, understand the difference between Lean Manufacturing and Six Sigma improvement approaches.
4. Energy Consumption
Energy tracking monitors power usage per machine or line in real time, linking energy spend directly to output volume and idle time. This makes waste visible without a full audit.
5. Production Throughput
Throughput tracking covers units produced, production speed versus target, and cycle time, the baseline numbers for measuring whether a line is meeting its plan. GlobalReader's platform monitors pieces, meters, and time duration as distinct data types, alongside environmental conditions, giving a complete picture of line output.
How GlobalReader captures each of the 5 categories
| Category | GlobalReader feature |
|---|---|
| Equipment performance (OEE) | Smart Live View shows live Availability, Performance and Quality on one screen, calculated continuously from sensor data. |
| Downtime and stoppages | Operator app captures downtime causes via tablet or smartphone; micro-stoppages are detected automatically by Scoutbox (hardware sensors). |
| Quality output | Operator app logs scrap and rework against the active order; Analytics surfaces patterns by shift, machine and material lot. |
| Energy consumption | Environmental conditions monitoring tracks power and other inputs alongside output volume. |
| Production throughput | Pieces, meters and time duration captured automatically from day one, no manual production logs. |
Knowing which categories to track is the starting point. The next question is how that data actually gets from the machine to the screen where decisions are made.
How Manufacturing Data Flows From Machine to Decision
Before data reaches a dashboard, it travels through four stages. Miss any one of them and the picture on screen stops reflecting what is actually happening on the floor.
Stage 1: Data Collection
Edge devices connect to a machine's PLC or CNC ethernet port, capturing signals without interrupting production.
IoT sensors mounted on equipment automate collection across the floor, eliminating gaps that manual reporting creates.
Operator inputs such as job clock-ins, downtime logs, and parts moves register as live events alongside machine signals.
- **SCADA systems** capture the core OEE inputs: availability (uptime and downtime), performance (cycle times and speeds), and quality (scrap rates and first-pass yield).
Modern manufacturing data collection works across both new and legacy machines through standard protocols like MTConnect (CNC machines), OPC UA (PLCs and SCADA) and MQTT (lightweight IIoT streams).
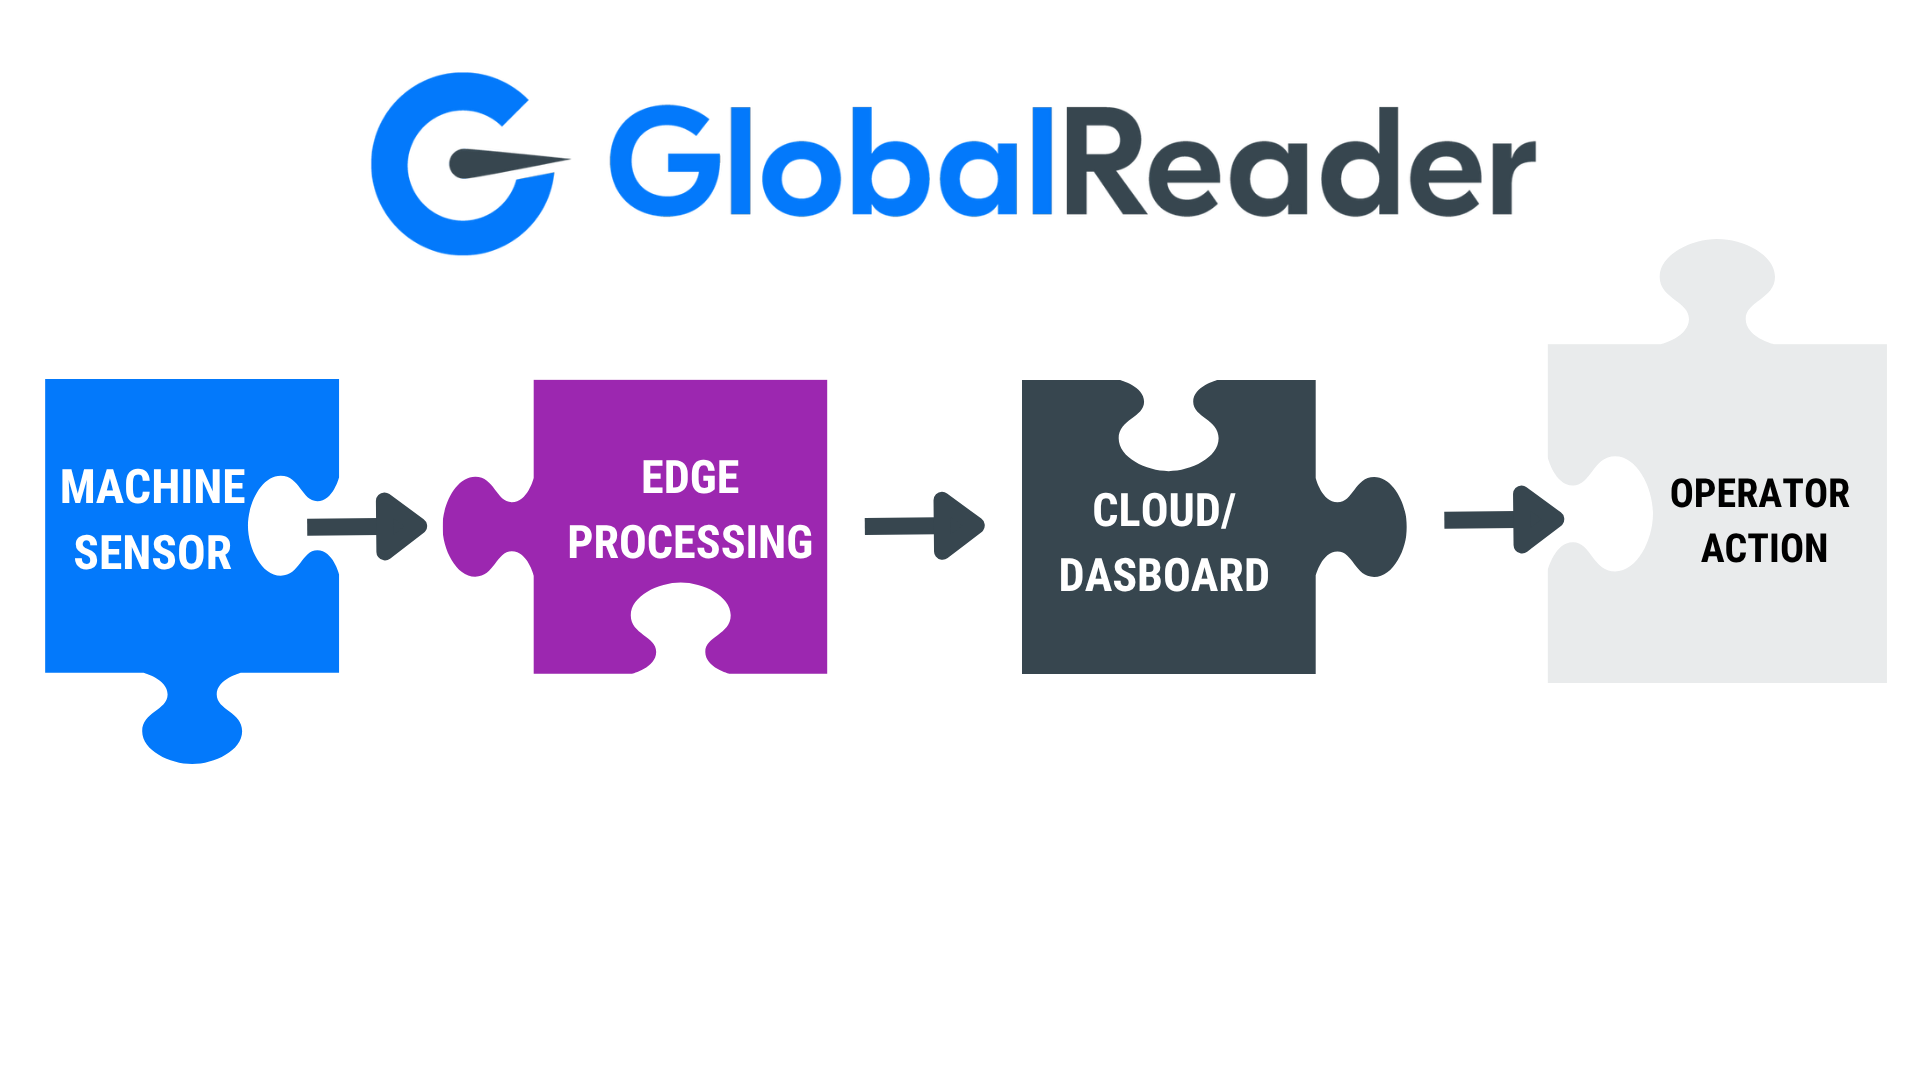
Stage 2: Edge Processing
Raw signals are processed at or near the edge, then streamed to the cloud and structured into metrics like cycle time, downtime events, and throughput counts.
Each event gets tagged with metadata: machine ID, operator, material lot, and timestamp. This tagging is what makes OEE calculations accurate and root-cause analysis possible.
Two protocols move data from machine layer to cloud: OPC UA handles structured machine-to-machine communication between PLCs, SCADA, and cloud gateways. MQTT handles lightweight, real-time data streaming where low latency matters more than message size.
MES sits between the shop floor and ERP, routing real-time production events to scheduling and quality systems.
Once the data is structured and in the cloud, it feeds two audiences at once: the shop floor team watching dashboards, and the business layer that needs production reality synced to planning.
Scoutbox is GlobalReader's edge device. It bolts onto an existing machine's PLC or CNC ethernet port and streams structured OEE data to the cloud. No PLC reprogramming, no production stop, no rip-and-replace of the existing stack. Read-only by default, isolated from the control network.
Stage 3: Visualisation
Processed data feeds into OEE dashboards showing live machine status, performance rates, and active downtime events. Operators and managers get a single view to act from, in real time.
Advanced analytics go further, flagging machines that are trending toward failure before a breakdown occurs. Smartwatch-delivered real-time alarms enabled operators to address stoppages before shifts ended, contributing to an 11% OEE increase.
| Format | Use it for | Update cadence |
|---|---|---|
| Dashboard | What is happening right now | Live: continuous |
| Alert | Act immediately on a threshold breach | Real-time, push |
| Report | Why a pattern emerged over time | Hourly to daily, scheduled |
Stage 4: Action and Decision
The ERP system acts as the single source of truth for management. Job completions, downtime logs, and part movements sync instantly so planners and managers always work from live data rather than shift-end reports.
| Layer | What it does | Update speed | Audience | Decision unlocked |
|---|---|---|---|---|
| Real-time data layer (Scoutbox + Smart Live View) | Capture from machines, structure, display | Seconds | Operators, supervisors | Stop the stoppage now |
| MES (Manufacturing Execution System) | Orchestrate production orders, quality, traceability | Seconds to minutes | Production engineers, quality | Run the shift correctly |
| ERP (Enterprise Resource Planning) | Schedule, finance, customer orders, inventory | Minutes to hours | Planning, finance, leadership | Plan the business |
The results are measurable: predictive analytics built on this data flow have produced a 25% reduction in unplanned downtime and more than 10% in manufacturing cost reduction.
Predictive maintenance and AI insights
On top of the same sensor stream, anomaly detection can flag machines drifting toward failure days before a breakdown. Vibration, temperature and cycle-time deviations are early warnings, picked up automatically by GlobalReader's AI insights add-on, which sits on the existing data flow rather than requiring a separate sensor network.
Dashboards, Alerts, and Reports: When to Use Each
Dashboards give you continuous visibility into what is happening now. Alerts push you to act immediately, and reports explain patterns over time. Used together, they cover every
decision speed.
| Tool | When to use it | Best displayed on | Time horizon |
|---|---|---|---|
| Dashboard | Continuous visibility into live machine state | Shop floor screens, tablets | Right now |
| Alert | Immediate action on a threshold breach | Mobile notifications, floor screens | This minute |
| Report | Pattern analysis and root-cause review | Desktop, shift review meetings | Past shift, week, or month |
GlobalReader Analytics lets managers switch between trend charts and detailed data tables, so the same dataset works for a quick shift review or a deep root-cause session.
Each format covers a different time horizon:
Dashboard: what is happening right now
Alert: act immediately on a threshold breach
Report: why a pattern emerged over time
End-of-shift paper reports create an 8-12 hour lag between a production event and management awareness. During that window, defective output keeps accumulating and downtime reasons get reconstructed from memory instead of logged at the point of failure.
Who Uses Real-Time Manufacturing Data and How
The same live dashboard means something different depending on where you sit in the factory.
Each role uses real-time data differently:
| Role | What they see | How they use it |
|---|---|---|
| Operator | Live status and alerts on tablet or smartphone next to the machine | Catch anomalies mid-shift, log downtime causes at the point of failure |
| Maintenance lead | Anomaly alerts, work-order triggers, MTBF/MTTR trends | Trace root causes and schedule maintenance before failure spreads |
| Supervisor | Multi-machine view, shift-by-shift OEE | Spot which line or process is dragging OEE down right now |
| Scheduler/planner | Plan-vs-actual, live job progress synced to ERP | Adjust sequencing on the fly, without waiting for a shift report |
| CEO/leadership | Site-wide OEE, capacity utilisation, cost-per-unit trend | End-of-month reviews start from facts instead of estimates |
Operators monitor machine status and catch anomalies mid-shift, before small issues become full stoppages.
- **Maintenance teams** trace downtime root causes and trigger work orders automatically, before a failure spreads.
Supervisors track shift-level performance across multiple machines, spotting which line or process is dragging OEE down.
Scheduling teams adjust job sequencing in real time, without waiting for end-of-shift reports.
Planners use the same live data to adjust job sequencing and compare plan vs actual without waiting for a shift report. Leaders see a consistent view across lines and sites, so end-of-month reviews start from facts instead of estimates.
Shop floor OEE data serves two levels at once. Operations managers use it for daily optimization; executives use the same dataset to inform capacity and investment decisions.
When sales, purchasing, and production teams work from the same live system, they stop relying on constant cross-department status calls to stay aligned.
See what real-time data looks like on your own shop floor. Try the free GlobalReader demo. No financial commitment, sign in with Google.
The ROI of real-time production data: a euro-per-machine view
Real-time production data has an unusually short payback because the savings are immediate.
| What you're losing today | Typical scale | What real-time data does | Saving per machine |
|---|---|---|---|
| Micro-stoppages (less than 2 min) | Invisible in manual logs | Detected and reduced 10-30% | EUR 300-900/month |
| Scrap and rework | 1-3% of output | Caught at the point of failure | EUR 200-700/month |
| Idle energy draw | Hidden in monthly bill | Surfaced and switched off | EUR 100-300/month |
| Shift-end reporting time | 30-60 min/supervisor/shift | Eliminated | EUR 200-500/month |
| Unplanned downtime | EUR 2000-3500 machine/month | 25-40% reduction first month | EUR 500-1400/month |
*Average GlobalReader customer saves around EUR 1000/machine/month. At a Foundation price of EUR 109/machine/month, the product pays itself back in roughly two days of avoided downtime.
There is a second, larger number that doesn't show up on the maintenance line: capacity unlock. A factory running at 60% OEE that lifts to 75% gets 25% more output without buying a new line.
Common Mistakes When Implementing Real-Time Data Monitoring
Even well-resourced factories make predictable mistakes when deploying real-time monitoring. Three mistakes appear across almost every deployment:
Poor data setup
Underestimating integration work
Failing to build a response culture around the data
| Mistake | Why It Happens | How to Avoid It |
|---|---|---|
| Poor sensor setup | Single-sensor installs cannot distinguish active production from idling | Use multi-signal inputs to capture machine state accurately |
| Underestimating integration | Teams underestimate the work of mapping tags and validating data | Allocate dedicated IT resources for the full configuration phase |
| Skipping cybersecurity planning | Legacy machines lack modern protocols, creating vulnerabilities on connection | Add middleware and network segmentation before connecting legacy equipment |
| Reactive maintenance culture | Teams only read data after failures, never before them | Assign alert owners and use the Maintenance module to act preventively |
| No alert ownership | High data volume with no escalation process leads to dashboard fatigue | Define thresholds, assign owners, and set escalation rules from day one |
Industry analysis from Cisco and McKinsey suggests 60-75% of industrial IoT initiatives stall during the pilot phase, usually because manufacturers try to build custom solutions without the technical foundation to scale them.
The fix is not a bigger rollout. It is a smaller start. Begin with one line or a few machines, confirm the data is accurate, then expand. GlobalReader is built for exactly this: start with the Foundation bundle and add Operator, Maintenance, Planner or Smart Factory modules when you are ready. A phased deployment across 10 machines after a four-month pilot reduced machine interruptions and let teams confirm data accuracy before scaling further.
Poor data configuration
A single-sensor setup often cannot distinguish a machine that is powered on from one that is actively producing. Idling machines appear productive, which distorts OEE calculations and masks real inefficiencies. Configure sensors to capture state, not just power.
Underestimating integration work
Configuration means mapping data tags, connecting to your network, and checking that the numbers are accurate. If you underallocate technical resources here, you will see poor data quality early and a slower payback. Modular pricing helps: GlobalReader's Foundation tier covers data collection and Smart Live View at EUR 109/machine/month so you can verify accuracy before adding modules.
Connecting legacy machines without middleware
Legacy industrial equipment was not designed with modern security protocols or encryption. Connecting it to a monitoring network introduces cybersecurity vulnerabilities and often requires middleware to translate proprietary data formats.
Reactive maintenance culture
If your team is always in firefighting mode, live data never gets used to prevent the next stop. It just records the last one. Use the GlobalReader Maintenance module to shift from reactive to preventive, and pair it with MTBF and MTTR reliability KPIs to measure progress.
No alert ownership
Real-time monitoring generates large volumes of data continuously. Without defined alert thresholds, assigned owners, and a clear escalation process, teams experience data overload and stop checking dashboards altogether. Define who owns each alert before you switch on the dashboard, not after.
Understanding MTBF and MTTR reliability KPIs helps teams measure whether their maintenance approach is actually preventing failures.
Start Collecting Real-Time Production Data With GlobalReader
GlobalReader pairs retrofit hardware with a modular cloud platform. You bolt Scoutbox sensors onto your existing machines, connect to the cloud, and get live OEE data without replacing your ERP or stopping production to rewire anything.
You can start with the basics and add Operator, Maintenance, Planner, and Smart Factory as you need them.
Scoutbox hardware installs directly on existing machines without replacing them. GlobalReader captures production counts, meter readings, time duration, and environmental conditions automatically from day one.
1. Mount Scoutbox sensors on your target machines (no machine replacement needed).
Connect to your network and configure data tags for each machine in the dashboard.
Set up shift schedules, reason codes, and downtime categories.
Train operators on the tablet or smartphone interface for live logging.
Review your first week of OEE data and identify the top three downtime reasons.
GlobalReader delivers this visibility through three core tools:
Smart Live View: live OEE and machine status updated in real time
Operator: captures downtime causes, active operators, and current products via tablet or smartphone
Analytics: real-time and near-real-time insights for production and quality managers
| Module | Price | What it adds |
|---|---|---|
| Foundation | EUR 125/machine/month | Smart Live View, real-time OEE, automated production data collection. Start here. |
| Operator | + feature module | Tablet or smartphone interface for downtime logging, active operator tracking and live job switching. |
| Maintenance | + feature module | Anomaly alerts, work-order triggers, MTBF/MTTR tracking. For shifting from reactive to preventive. |
| Planner | + feature module | Plan-vs-actual, live job sequencing synced to ERP. For scheduling teams. |
| AI insights | Add-on | Anomaly detection on the existing data stream. Predictive maintenance without a separate sensor network. |
Factories using GlobalReader report significant reductions in unplanned downtime and faster shift reviews. If you want to see results from a similar operation, explore the case studies at globalreader.eu.
GlobalReader integrates with your existing ERP to sync shop floor sensor data with production scheduling and orders.
Try the free demo and see your production data live. No financial commitment. Sign in with Google and explore at your own pace.
-
Real-time production refers to manufacturing processes where data from equipment, sensors, and operators is captured and made available for decisions within milliseconds to seconds of each event occurring on the factory floor.
Real-time data enables continuous OEE calculation rather than end-of-shift estimates. Operators can identify and correct availability, performance, or quality losses mid-shift before they compound into missed targets.
-
A practical example of real-time data in manufacturing is a vibration sensor mounted on a CNC spindle that streams readings every millisecond. If amplitude spikes above a threshold, it triggers an alert signalling bearing wear before a breakdown occurs.
GlobalReader sensors capture machine states and output counts for OEE calculations. The AI insights add-on extends this with anomaly detection to flag machines trending toward a problem before a breakdown occurs.
This data-driven approach typically cuts unplanned downtime by 30-50% (Aberdeen Group manufacturing benchmark).
-
The most common systems are PLCs, SCADA, MES, IIoT sensor platforms, and data historians. Each layer plays a different role in how data moves from machine to decision.
IIoT sensor platforms often show faster ROI than standalone PLC or SCADA upgrades because they combine data collection, cloud processing, and dashboards in one deployment, reducing integration time and cost. A packaging plant that deployed IIoT reduced downtime 30% and improved OEE from 65% to 78%, with results visible within weeks of installation.
GlobalReader combines hardware sensors and cloud software to monitor production pieces, meters, time duration, and environmental metrics in real time. It sits alongside existing ERP systems, syncing shop floor data with scheduling and orders rather than replacing your current stack.
If you want to see how this works on your own machines, try GlobalReader for free at demo.globalreader.eu. No financial commitment needed.
-
Strictly, no, that is near-real-time. True real-time means sub-second to seconds, driven by sensor events rather than a polling interval. For most shop-floor decisions a 1-5 minute refresh is sufficient, but on fast-cycle machines or for downtime alerts, the polling interval becomes the ceiling on how quickly you can react.
-
OEE multiplies Availability x Performance x Quality. Real-time data feeds each component continuously: uptime and stoppages drive Availability, cycle times drive Performance, and scrap and first-pass yield drive Quality. Because every input updates in seconds, OEE itself can be calculated live rather than reconstructed at shift end from operator notes.
-
GlobalReader integrates with existing ERP systems via REST API, syncing shop-floor sensor data with production scheduling and orders. Job completions, downtime logs and part movements flow back into the ERP automatically. GlobalReader sits alongside the ERP rather than replacing it, the ERP remains the system of record for finance, scheduling and customer orders.
-
Yes. Legacy CNCs, PLCs and equipment without modern interfaces are common. Scoutbox connects directly to a machine's PLC or CNC ethernet port and reads signals without interrupting production or rewiring the machine. Legacy connections are read-only and isolated from the control network, which addresses the security concern most IT teams raise.
-
Average GlobalReader customers save around EUR1000/machine/month in the first quarter from downtime reduction, micro-stoppage capture, scrap reduction and eliminated reporting time. At Foundation pricing of EUR 109/machine/month, the product pays itself back in roughly two days of avoided downtime. Independent benchmarks (Aberdeen Group) report 30-50% unplanned downtime reduction with real-time monitoring in place.